Introducing A/B Test Calculator: Know If Your Experiment Is Real
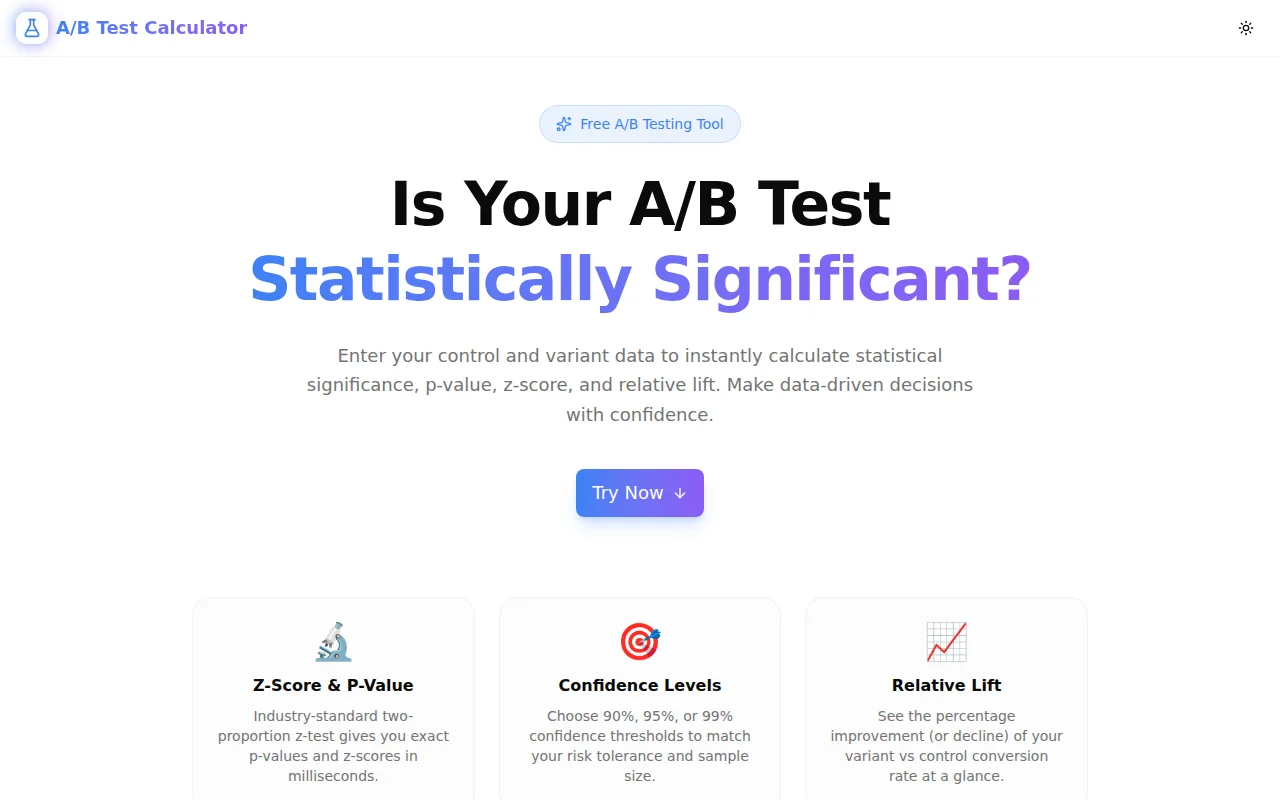
A free, instant A/B test statistical significance calculator. Enter your control and variant data — get z-score, p-value, relative lift, and a clear verdict in under 10 seconds.
Introducing A/B Test Calculator: Know If Your Experiment Is Real
We built a free A/B test statistical significance calculator. Enter four numbers — visitors and conversions for your control and variant — select a confidence level, and get a clear answer in under 10 seconds. No login. No spreadsheet. Just math.
→ ab-test-calculator.tools.jagodana.com
What Is A/B Test Statistical Significance?
Statistical significance tells you whether the difference in conversion rates between your control (original) and variant (test) versions is likely real — or likely due to random chance.
When you run an experiment and variant B converts at 6.5% vs. control A at 5.0%, you don't automatically have a winner. You have a hypothesis. Statistical significance is the test that turns that hypothesis into a confident decision.
The standard measure is the p-value. A p-value below your threshold (e.g. p < 0.05 for 95% confidence) means the probability of this difference occurring by random chance is less than 5%. That's when you can confidently declare a winner.
Why Does This Tool Exist?
There are two kinds of A/B test analysis errors product teams make every day.
Error 1: Calling a winner too early. Variant B has 50 conversions vs. 40 for control A after three days. "Ship it." Nobody ran significance. The uplift was noise.
Error 2: Never calling a winner. An experiment ran for six weeks. The team isn't sure whether to trust the result. The variant sits in limbo while traffic splits between versions indefinitely.
Both errors cost money. The first one ships changes that don't work. The second one kills the velocity that makes experimentation valuable in the first place.
The fix is a 30-second calculation that most teams skip because they don't have the tool in front of them when they need it.
How Does the A/B Test Calculator Work?
What math does it use?
The calculator runs a two-proportion z-test — the standard statistical test for comparing two conversion rates. The steps:
- Calculate conversion rates: p₁ = conversions₁ / visitors₁, p₂ = conversions₂ / visitors₂
- Compute pooled proportion: p = (c₁ + c₂) / (n₁ + n₂)
- Calculate standard error: SE = √(p × (1−p) × (1/n₁ + 1/n₂))
- Compute z-score: z = (p₂ − p₁) / SE
- Convert to p-value using the normal CDF: p-value = 2 × (1 − Φ(|z|))
All computation runs in your browser. Nothing is sent to any server.
What does the z-score mean in an A/B test?
The z-score measures how many standard errors apart your two conversion rates are. The further apart (higher |z|), the more confident you can be the difference is real.
Common thresholds:
- |z| ≥ 1.645 → 90% confidence
- |z| ≥ 1.960 → 95% confidence (industry standard)
- |z| ≥ 2.576 → 99% confidence (high-stakes decisions)
What does relative lift mean?
Relative lift is the percentage improvement of variant over control: ((variant CVR − control CVR) / control CVR) × 100.
A 5% control CVR and 5.5% variant CVR is a +10% relative lift, not a +0.5% lift. The distinction matters when presenting results to stakeholders.
What Confidence Level Should I Use?
95% is the standard for most conversion rate optimization work. It means you accept a 5% chance of declaring a winner when there isn't one (a false positive).
Use 90% when:
- The experiment has a short run time and you need to decide quickly
- The change is low-risk and easily reversible
- Traffic is limited and you can't wait for a 95% result
Use 99% when:
- The change affects the checkout or payment flow
- You're running a permanent pricing change
- The cost of a false positive is high (e.g. personalization at scale)
How Much Traffic Do I Need to Reach Significance?
This depends on three things: your baseline conversion rate, your expected minimum detectable effect (MDE), and your desired confidence level.
A rough guide for 95% confidence and 80% statistical power:
| Baseline CVR | +10% Relative Lift MDE | Visitors/Variant | |:---:|:---:|:---:| | 1% | 0.1% abs. | ~75,000 | | 3% | 0.3% abs. | ~25,000 | | 5% | 0.5% abs. | ~15,000 | | 10% | 1.0% abs. | ~7,500 |
These are minimums. Always run experiments to completion — stopping early inflates false positives dramatically.
What Makes This Calculator Different?
Evidence Strength Indicator
Beyond a binary pass/fail, the tool shows evidence strength: Strong, Moderate, or Weak. A result that barely clears the significance bar is very different from one that clears it by 2×. The evidence strength helps you calibrate how much to trust the result.
Clean Verdict Banner
The tool surfaces a plain-English verdict at the top of the results: "Statistically Significant — 95% Confidence" or "Not Statistically Significant." No decoding required.
Input Validation
The tool catches impossible inputs before you calculate: conversions exceeding visitors, negative numbers, empty fields. It tells you exactly what to fix.
Zero Setup
No login. No API key. No SDK. Paste in four numbers, click Calculate, get an answer.
Who Is This For?
Product managers running feature experiments who need to document significance before shipping.
Growth engineers managing a portfolio of experiments and needing quick significance checks across all of them.
CRO consultants who need to show clients why their "winning" variant with 80 conversions per group isn't actually significant.
Marketers split-testing email subject lines, ad copy, or landing page headlines.
Founders with limited traffic who need to understand what confidence level their current sample size supports.
Try It Now
ab-test-calculator.tools.jagodana.com
Free. No account. Works in any browser. Your data never leaves your device.
Built as part of the 365 Tools Challenge — one useful tool every day for developers, designers, and product builders.